Java Safepoint and Async Profiling

While deep into the woods of Java lot of times most developers have faced performance issue with their application. Even with microservices, though the complexity of the application is small, it can still suffer from performance issues like, too much computation processing going on, or DB calls taking too long, or lot of IO happening all the time.
Java profiling helps you debug these kind of issues if you wanted to know
- CPU utilization
- Memory utilization/ memory leak
- Are there any deadlock scenarios, etc
While java does provide default tooling for CPU profiling and memory profiling most of the time profiling your application in staging/production has the danger of bringing your entire application down due to the overhead involved in profiling. Async profiling is a low overhead sampling profiler for Java that does not suffer from Safepoint bias problem. It features HotSpot-specific APIs to collect stack traces and to track memory allocations. The profiler works with OpenJDK, Oracle JDK and other Java runtimes based on the HotSpot JVM.
Before we talk about why async profiling, we need to know what is the safepoint bias problem is! Before we talk about that problem we need to understand what is safepoint is!!!
So..Let’s talk to a java thread to understand these questions! ✋
What is a Safe point?

At safepoint,
- I know my exact state in my interaction with the heap
- all my references on the stack are mapped
- JVM can account for all my references
- thank you JVM! My view of the world remains consistent at this “safe point”
- I am blocked at a safe point that no body can pull me for any other tasks
When is a thread at a safe point?
I am at a safepoint when I am doing these ⬇️ tasks!

- All these events are qualified as orderly de-scheduling events for the Java thread
- as part of tidying things up before put on hold, the threads are brought to a safe point
Also please know that I am not at a safepoint when I am doing these ⬇️ tasks!

JVM — Threads relationship 💞
Only if every relationship is this perfect!

Bringing a thread to safe point

- threads poll for safe point flag at “reasonable” intervals
- they transition them into safe points when they observe “go to safe point flag”
- keep the polling interval at minimum since that would add significant overhead and we don’t want to spend all the time checking if we need to stop the C1/C2 compilers
- on top of this, maintaining a “known state” add more complexity as well
So keeping these in mind, safe point polls are done at these locations
- Between any 2 byte codes while running in the interpreter
- On “non-counted” loop back edge in C1/C2 compiled code
- Method entry/exit in C1/C2 compiled code
What is a safepoint bias problem?
Most profilers are limited to safepoint sampling. You hit a global safepoint whether you are sampling a single thread or all threads. So this adds up to setting up a timer thread which triggers at sampling_interval and gathers all stack traces. This is bad for several reasons
- Sampling profilers need samples! So it is common to set the sampling frequency pretty high. Say for example a profiler is sampling 10 times a second or every 100ms, and it creates 5ms pause to do its job depending on the depth of the stack trace, number of threads, etc., So a 5ms pause every 100ms means 5% overhead introduced by profiling. Even if you set the frequency interval longer you need to profile for longer time to get any meaningful sampling count!
- Gathering full stack traces from all your threads means the cost of profiling is open ended.
- The worst thing of all is, profilers are trying to sample threads at safepoint to avoid these overheads, but in reality you would want to sample the threads which are actually doing something rather than spending all of their time blocked!
So what does sampling at a safepoint mean? It means only the safepoint polls in the running code are visible. Given hot code is likely compiled by C1/C2 (client/server compilers) we have reduced our sampling opportunities to method exit and uncounted loop back edges. This leads to the phenomena called safepoint bias whereby the sampling profiler samples are biased towards the next available safepoint poll location This fails the criteria set out for an ideal profiler that — “the profiler should sample all points in a program run with equal probability”
Now after knowing what a safepoint is and how most profilers are suffering from safe point bias problem, using Async profiler makes much more sense. You can read more about async profiler in their Github page.
Here is some shell scripting to create short cuts to take async profiling from kubernetes pods.
async-profiling.sh
#!/bin/bash
if [$# -ne 1 ]; then
  echo >&2 "Usage: $0 [ <duration-in-seconds> ]"
  exit 1
fi

# Install async-profiler
if [! -f "./profiler.sh" ]; then
  curl -L https://github.com/jvm-profiling-tools/async-profiler/releases/download/v1.8.1/async-profiler-1.8.1-linux-x64.tar.gz > async.tar.gz
  tar xfvz async.tar.gz
fi

rm -f flame.svg
echo "profiling for $1 seconds..."./async-profiler-1.8.1-linux-x64/profiler.sh -d "$1" -f $(pwd)/flame.svg 1 --all-user -e alloc
- Executing inside a k8s pod to run async profiling
function kubectl_async_profiling_single_pod() {
  if [$# -ne 2 ]; then
    echo "Usage $0 <pod-name> [ <duration-in-seconds> ]"
    echo "Make sure to execute from the directory where async-profiling.sh file exists"
    echo "Example $0 pod_name 120"
    echo ""
    return 1
  fi
  if [! -f "async-profiling.sh" ]; then
    echo "Make sure to execute from the directory where async-profiling.sh file exists"
    echo "Exiting..."
    return 1
  fi

  filename="$1-$(date +'%m-%d-%Y-%H-%M-%S')-flame.svg"
  echo "Executing on pod $1"
  kubectl cp async-profiling.sh alfa/"$1":.
  kubectl exec "$1" chmod +x async-profiling.sh
  kubectl exec "$1" ./async-profiling.sh "$2"
  kubectl cp alfa/"$1":flame.svg ./output/"$filename"
  echo "Downloaded $filename"
}kubectl_async_profiling_single_pod <pod-name> <duration-in-seconds> Example --> kubectl_async_profiling_single_pod my-k8s-app-8678f86c5f-5jvpt 600
This will create the flame svg file in the format pod-name-MM-DD-YYYY-HH-SS-MM-flame.svg in ./output folder
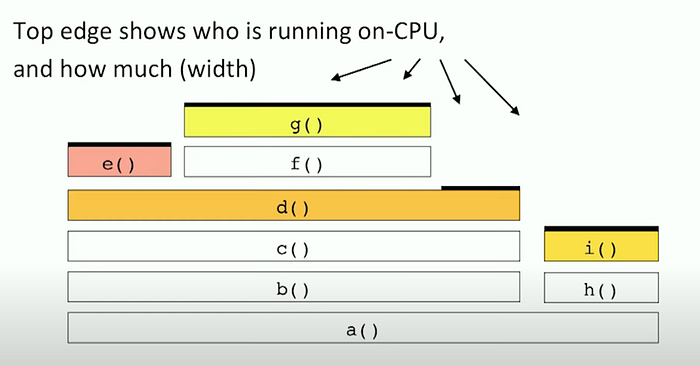
How to interpret a flame graph?

Read it from bottom-up.
a()callsb()andh()b()callsc()c()callsd()and so on..- Flame graph is alphabetically ordered not ordered by the time it took for each method — notice
e()andf() - Flame graph don’t have timestamps. We just know
b()executed longer thanh()

- here
g()is consuming the most CPU cycles

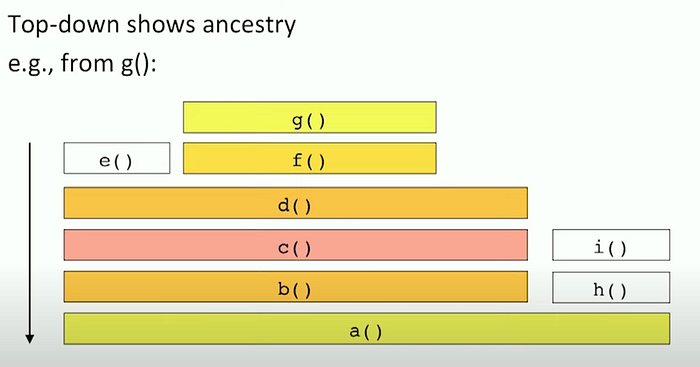
- while looking to optimize
g()we might need to look at the stack call forg()and see where the optimization can be done

